
Math
Free Printable Multiplication Chart (12 × 12 and 10 × 10)
Filled, blank, and missing-number charts with answer keys, how to read one, and how to use it to learn the times tables a family at a time.
Grades: grade 2 to grade 3 · Common Core: 3.OA.C.7, 3.OA.D.9 · Texas: 3.4(F) · Related: Common Core 2.OA.C.4, 3.OA.B.5, 3.OA.B.6; Texas 3.4(D), 3.4(E), 3.4(J)
The free printable multiplication charts are three PDFs on this page, in two sizes, 12 × 12 and 10 × 10, as filled, blank, and missing-number charts. Every blank and missing-number page has an answer key, and every sheet is designed to print in black and white. The full 12 × 12 chart is on this page too, to read on screen.
A multiplication chart is a grid with the numbers 1–10 (or 1–12) across the top and down the side, where every square holds the product of its row and its column. It shows every multiplication fact a third grader learns on one page. A 10 × 10 chart looks like 100 facts, but every fact off the diagonal appears twice, as 3 × 8 and 8 × 3, so it holds 55 different facts. A child who learns them a family at a time, with the 2s, 5s, and 10s first and the 7s last, watches the facts that are left shrink to one.
The most useful move at home is to use the chart to find which facts your child already knows, then practice the next family until it no longer needs the chart. Print the 12 × 12 if your child’s class uses one, and the 10 × 10 for the facts third grade requires.
Free printable multiplication charts: 12 × 12 and 10 × 10
The multiplication charts come as three PDFs, one for each job a chart does: looking facts up, filling them in, and checking which are left.
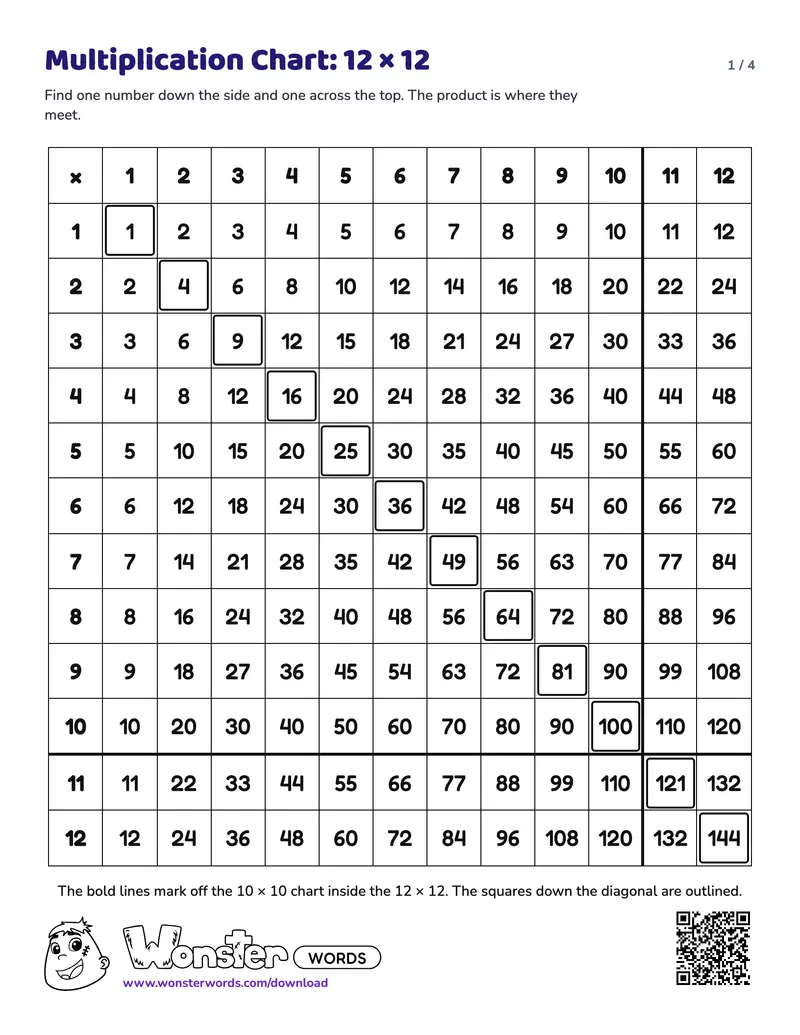
- Multiplication Chart, 4 pages. Page 1: 12 × 12, filled, with a heavy line after the 10 row and the 10 column so the 10 × 10 inside it shows. Page 2: 10 × 10, filled, the chart a “multiplication chart 1–100” search means. Page 3: the chart in learning order, the 10 × 10 with its headers in the order kids learn the tables (2, 5, and 10 first, 7 last) rather than in number order, so each family’s new facts form one band. Print this one to look facts up and to see the order.
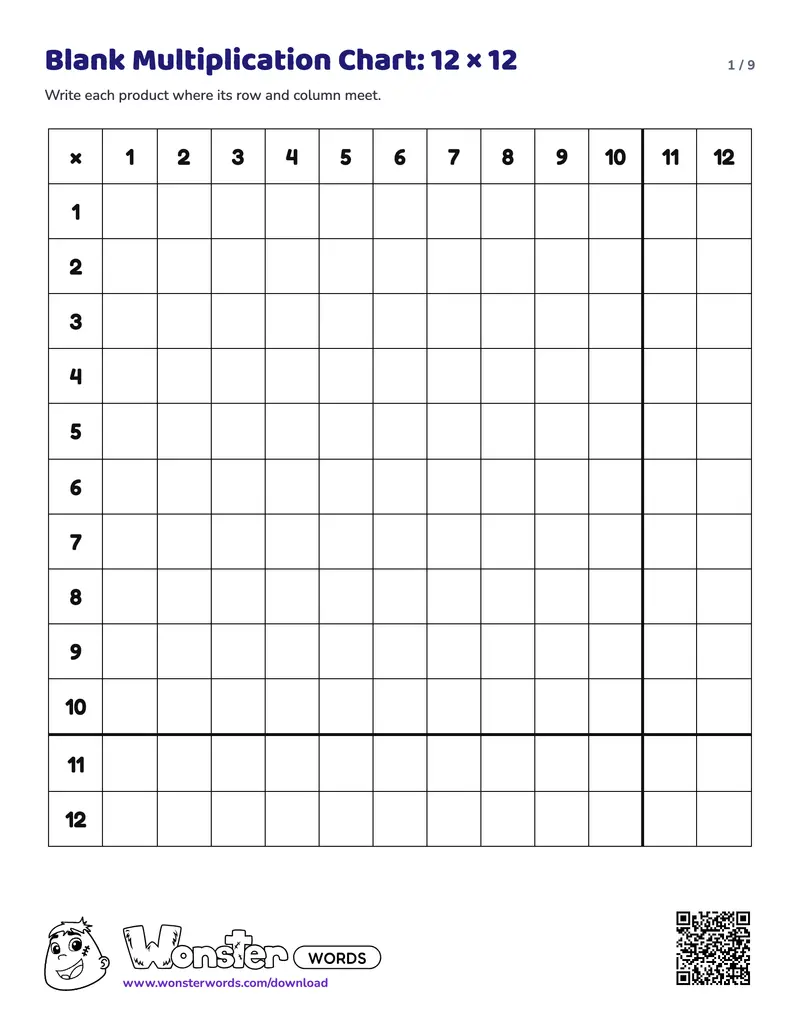
- Blank Multiplication Chart, 9 pages. Pages 1 and 2: 12 × 12, blank, first with the headers in order and then with them mixed so a child cannot count along a row. Pages 3 and 4: the same in 10 × 10. Each blank page has its own answer key. Print this one once your child knows a few families.
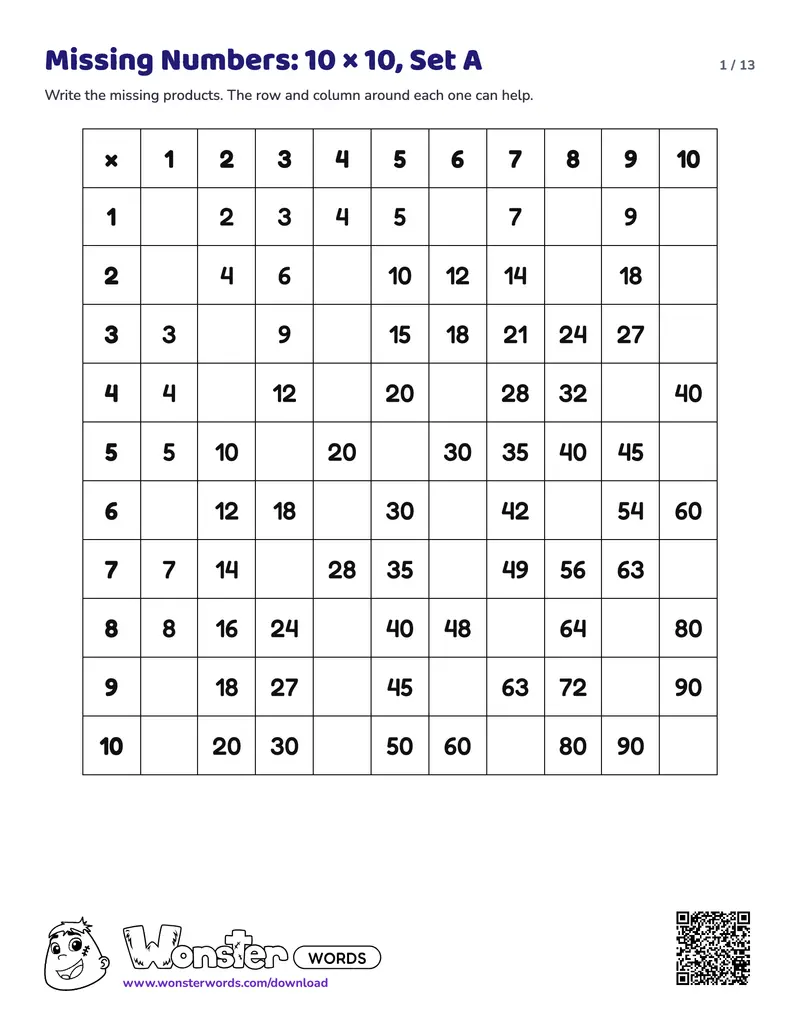
- Multiplication Chart Missing Numbers, 13 pages. Pages 1 and 2: 10 × 10 with about a third of the squares empty, two sets. Pages 3 and 4: the same in 12 × 12. Pages 5 and 6: the 36 facts that are left after the 2s, 5s, 10s, and 1s, first in one block on the chart in learning order and then scattered on the chart in number order. Each page has its own answer key. Print this one for a quick check of which facts are still slow.
Every sheet is black and white by design. The families are marked with bold lines and light hatching, never with color, so a chart prints on any printer, even one low on ink. Each PDF ends with a page for grown-ups on what the chart practices and how to use it. For a parent who would rather draw one, the blank PDF is the grid ready-made, and making your own chart shows how.
Once the chart is put away for a run of families, a sheet of the facts in mixed order is the next practice.
Free PDF · no sign-up
Free printable multiplication charts
Three free PDFs in black and white, with no account and no email: the filled 12 × 12 and 10 × 10 charts with a chart in learning order, the blank charts, and the missing-number charts with their answer keys. Every PDF ends with a page for grown-ups on how to use it.
- Multiplication Chart (PDF)344 numbers · 4 pages
Preview page 1Preview
- Blank Multiplication Chart (PDF)488 products · answer key included · 9 pages
Preview page 1Preview
The whole 12 × 12 chart, to read on screen:
| × | 1 | 2 | 3 | 4 | 5 | 6 | 7 | 8 | 9 | 10 | 11 | 12 |
|---|---|---|---|---|---|---|---|---|---|---|---|---|
| 1 | 1 | 2 | 3 | 4 | 5 | 6 | 7 | 8 | 9 | 10 | 11 | 12 |
| 2 | 2 | 4 | 6 | 8 | 10 | 12 | 14 | 16 | 18 | 20 | 22 | 24 |
| 3 | 3 | 6 | 9 | 12 | 15 | 18 | 21 | 24 | 27 | 30 | 33 | 36 |
| 4 | 4 | 8 | 12 | 16 | 20 | 24 | 28 | 32 | 36 | 40 | 44 | 48 |
| 5 | 5 | 10 | 15 | 20 | 25 | 30 | 35 | 40 | 45 | 50 | 55 | 60 |
| 6 | 6 | 12 | 18 | 24 | 30 | 36 | 42 | 48 | 54 | 60 | 66 | 72 |
| 7 | 7 | 14 | 21 | 28 | 35 | 42 | 49 | 56 | 63 | 70 | 77 | 84 |
| 8 | 8 | 16 | 24 | 32 | 40 | 48 | 56 | 64 | 72 | 80 | 88 | 96 |
| 9 | 9 | 18 | 27 | 36 | 45 | 54 | 63 | 72 | 81 | 90 | 99 | 108 |
| 10 | 10 | 20 | 30 | 40 | 50 | 60 | 70 | 80 | 90 | 100 | 110 | 120 |
| 11 | 11 | 22 | 33 | 44 | 55 | 66 | 77 | 88 | 99 | 110 | 121 | 132 |
| 12 | 12 | 24 | 36 | 48 | 60 | 72 | 84 | 96 | 108 | 120 | 132 | 144 |
What is a multiplication chart?
A multiplication chart is a square grid of products: the numbers 1–10 or 1–12 run across the top and down the left side, and each square holds the product of its row number and its column number. It is also called a multiplication table, a times table chart, or a times tables chart, and all four names mean the same grid. Each row is one times table read across: the 7 row is 7, 14, 21, and on to 70. That is skip counting written down, the same counting by 2s, 5s, and 10s a child does on a hundreds chart, with one row for each number.
The chart holds every fact the Common Core asks of third grade. Its standard 3.OA.C.7 reads: “By the end of Grade 3, know from memory all products of two one-digit numbers.” A chart puts the year’s facts on one sheet, where a child can see which are known and which are left. An addition chart is the same idea for sums.
How do you read a multiplication chart?
To read a multiplication chart, find one number down the left side and the other across the top, and follow the row and the column until they meet. For 7 × 8, put one finger on 7 down the side and one on 8 across the top, then slide them along the row and down the column: they meet at 56.
| × | 1 | 2 | 3 | 4 | 5 | 6 | 7 | 8 | 9 | 10 |
|---|---|---|---|---|---|---|---|---|---|---|
| 1 | 1 | 2 | 3 | 4 | 5 | 6 | 7 | 8 | 9 | 10 |
| 2 | 2 | 4 | 6 | 8 | 10 | 12 | 14 | 16 | 18 | 20 |
| 3 | 3 | 6 | 9 | 12 | 15 | 18 | 21 | 24 | 27 | 30 |
| 4 | 4 | 8 | 12 | 16 | 20 | 24 | 28 | 32 | 36 | 40 |
| 5 | 5 | 10 | 15 | 20 | 25 | 30 | 35 | 40 | 45 | 50 |
| 6 | 6 | 12 | 18 | 24 | 30 | 36 | 42 | 48 | 54 | 60 |
| 7 | 7 | 14 | 21 | 28 | 35 | 42 | 49 | 56 | 63 | 70 |
| 8 | 8 | 16 | 24 | 32 | 40 | 48 | 56 | 64 | 72 | 80 |
| 9 | 9 | 18 | 27 | 36 | 45 | 54 | 63 | 72 | 81 | 90 |
| 10 | 10 | 20 | 30 | 40 | 50 | 60 | 70 | 80 | 90 | 100 |
Every fact off the diagonal is on the chart twice. Start at 8 down the side and 7 across the top, and the fingers meet at 56 again. The chart is a mirror across its diagonal from 1 to 100, which the Common Core states as “If 6 × 4 = 24 is known, then 4 × 6 = 24 is also known” (3.OA.B.5). Schools call this a turnaround fact, and its name in math is the commutative property.
The chart answers division too, read backward. For 56 ÷ 8, find 56 in the 8 row and go up to the top of its column: 7. That is division as a missing factor, 8 times what makes 56, which is third-grade standard 3.OA.B.6.
Two slips are common. The first is sliding along the wrong row. A ruler or a folded sheet of paper laid under the row fixes it, and it helps any child who loses their place. The second is starting from 0. On a chart that begins at 1, the first square in the 7 row is 1 × 7 = 7, not 0.
To explain the chart to a child, start with the 10 row and the 2 row, which they can already skip count. Let them find a fact they know before one they do not.
How to use a multiplication chart to learn the times tables
Print a filled chart and a blank one, and spend a few minutes, a few times a week, on one family of facts. The six steps take a child from a first look at the chart to needing it only for checking. Stay on each step for as long as it takes.
Read it together first
Find five facts your child already knows, such as the 10s and the 2s, and tick them on a printed chart. The ticked squares are what is known, and the rest is what is left.
Notice the mirror
Cover the half of the chart below the diagonal. Every fact under it is already on the other side, since 3 × 8 and 8 × 3 are both 24. That halves the job, to 55 different facts on a 10 × 10 chart and 78 on a 12 × 12.
Learn one family at a time
Take the 2s, 5s, and 10s first, then the 1s, then the 3s and 4s, then the 6s and 8s, then the 9s, and the 7s last. Each family leans on one already known: the 4s are double the 2s, the 6s double the 3s, the 8s double the 4s, and the 9s are ten groups minus one.
Fill the blank chart a family at a time
For each new family, fill its row and its column on a blank chart, from memory or by working each fact out, then check against the filled chart. Keep it to a few minutes, a few times a week, rather than one long session.
Mix them up
Once a run of families is quick, fill a blank chart whose headers are in a mixed order. The facts are the same, but there is no row to count along, so each one has to be known.
Put the chart away for the facts that are known
Keep the chart for checking and for the facts that are left. After the 2s, 5s, 10s, and 1s, only 36 of the 100 squares are still to learn, and after the 9s the one new fact is 7 × 7.
The strategy behind each family, such as doubling the 3s to get the 6s, is taught in a strategy for each times table. This page names the order, and that one teaches each table.
For a game, roll two dice, say the product, and cover it on the blank chart with a counter or a pencil mark.
Patterns in the multiplication chart
A multiplication chart is full of patterns a child can find with a finger, and finding them is schoolwork, not a trick. The Common Core’s third-grade standard 3.OA.D.9 asks children to “Identify arithmetic patterns (including patterns in the addition table or multiplication table)” and to explain them. Seven to look for on a printed chart:
- The square numbers run down the diagonal: 1, 4, 9, 16, and on to 100. The chart is a mirror across that line.
- The 10 row ends in 0, and the 5 row ends in 5, 0, 5, 0 all the way along.
- The 2, 4, 6, 8, and 10 rows hold only even numbers. The standard’s own example is that “4 times a number is always even”.
- Doubling. The 4 row is the 2 row doubled, the 8 row is the 4 row doubled, and the 6 row is the 3 row doubled.
- The 9 row, up to 9 × 10: the tens digit is one less than the number multiplied, and the two digits add to 9. For 9 × 7 = 63, the 6 is one less than 7, and 6 + 3 = 9. The Common Core progressions trace this to 9 being 10 minus 1 (p. 26).
- On a 12 × 12 chart, the 11 row repeats its digit up to 11 × 9: 11, 22, 33, and on to 99.
- Times 1 and times 0 are not the addition patterns. A number times 1 stays the same, and a number times 0 is 0. The progressions note that “students often confuse these three patterns”: adding 0, times 0, and times 1 (p. 26).
On an addition chart, every row counts on by one, so each square is one more than the square before it. On a multiplication chart, every row counts on by its own number: the 7 row goes up by 7 each square.
Why the order is the 2s, 5s, and 10s first and the 7s last. The progressions say patterns “make multiplication by some numbers easier to learn than multiplication by others”, and that “the count-by sequence for 5 is easy, but the count-by sequence for 7 is difficult” (pp. 25–26). They add that teaching approaches “may teach multiplications and divisions in various orders depending on what numbers are seen as or are supported to be easiest”, so the order in this guide is one sound order among several. What it buys can be counted on a 10 × 10 chart of 55 different facts:
| After learning | Different facts left of 55 |
|---|---|
| The 2s, 5s, and 10s | 28 |
| The 1s | 21 |
| The 3s and 4s | 10 |
| The 6s and 8s | 3: 7 × 7, 7 × 9, and 9 × 9 |
| The 9s | 1: 7 × 7 |
By the time a child reaches the 7s, the one new fact is 7 × 7. A fact that will not stick can be split into two that have: 7 × 8 is 5 × 8 plus 2 × 8, or 40 + 16. That split is the idea behind the area model. The same order, family by family, is set out in what order kids learn the times tables in.
12 × 12 or 10 × 10: which multiplication chart does my child need?
A 10 × 10 multiplication chart covers every fact the standards require, and a 12 × 12 chart adds the 11s and 12s. The Common Core asks third graders for “all products of two one-digit numbers” (3.OA.C.7), and Texas asks them to “recall facts to multiply up to 10 by 10 with automaticity” (TEKS 3.4(F)). Many printed charts and many classrooms use a 12 × 12 anyway.
Print the 10 × 10 to learn the facts, and the 12 × 12 if the class or the homework uses one. Start on the 10 × 10 and add the 11 and 12 rows when the class does. On our 12 × 12 chart, a heavy line after the 10 row and the 10 column marks where the 10 × 10 ends. The new facts are the ones outside the line. For practice past the line, the times tables guide has a sheet for the 11s and 12s.
A “multiplication chart 1–100” is the 10 × 10 chart, whose products run from 1 to 100. Charts past 12 × 12 go beyond anything third grade asks.
What age is a multiplication chart for?
A multiplication chart is for third grade, at about ages 8–9, the year children learn the multiplication facts and are expected to know them all from memory by the end. Second grade builds what the chart rests on, and a younger child has a different chart to use.
| Grade | What children do | Standards | Which chart |
|---|---|---|---|
| Before 2nd grade | Count to 100 by ones and tens, then to 120 | None for multiplication | The hundreds chart |
| 2nd grade | Arrays up to 5 rows and 5 columns; skip counting by 5s and 10s | Common Core 2.OA.C.4, 2.NBT.A.2 | The 2, 5, and 10 rows as a skip-counting strip |
| 3rd grade | Equal groups and arrays, then the facts, then all of them from memory | Common Core 3.OA.C.7, 3.OA.D.9; Texas 3.4(D)–(F) | The whole chart, filled and then blank |
| 4th grade and up | Multi-digit multiplication, which assumes the facts | Builds on 3.OA.C.7 | A check, not a tool |
Second grade builds the ground with arrays “with up to 5 rows and up to 5 columns” (2.OA.C.4), which is where multiplication starts to make sense. A first grader has no multiplication standard, so a first grader’s chart is the hundreds chart. Some programs teach the tables in second grade, and the multiplication guide covers a child who is ahead.
What makes a good multiplication chart? Layout, size, and color
A good multiplication chart is easy to follow along a row, marks its patterns, and has nothing else in the grid. Five things to look for, which are also how ours are made:
- Numerals big enough to read at arm’s length, and on a blank chart, squares big enough to write a three-digit product such as 144.
- A heavy header row and column, so the eye finds the two numbers being multiplied.
- Rows that can be followed: ruled lines, and on a 12 × 12 a bold line after the 10 row and column, so a finger does not slip.
- The diagonal marked, so the mirror shows.
- No clutter: no pictures inside the grid.
On color: color can make a family stand out, but a chart that relies on it loses the pattern when it prints in black and white. Ours mark the families with bold lines and light hatching, with one line on the sheet saying what the marks mean. A child can color a row in as they learn it.
On size: the chart a child uses is a letter-size copy at the desk. For a poster, use a copy shop’s enlargement setting rather than taping pages together. A blank chart in a plastic sleeve becomes a dry-erase chart to fill in again and again.
For a child who struggles, a ruler or an L-shaped card cut from paper under the row keeps the place. Start with the 10 × 10, or with one family’s row and column only. If your child’s school allows a chart on classwork as an accommodation, that is a question for the teacher.
How do you make your own multiplication chart?
To make your own multiplication chart, draw a grid one square bigger than the chart each way, write the numbers along the top and the side, and fill each row by skip counting. Step by step:
- Gather squared or plain paper, a ruler, and a pencil.
- Draw the grid: 11 squares by 11 for a 10 × 10 chart, since one row and one column hold the headers, or 13 by 13 for a 12 × 12.
- Write 1–10 across the top and down the side, or 1–12 for the bigger chart.
- Fill each row by skip counting: the 3 row is 3, 6, 9, and on to 30.
- Use the mirror. Once the 3 row is done, the 3 column holds the same numbers, so every row fills part of the others.
- Mark the diagonal and the 10 row, as a good chart does, and check the finished chart against a filled one.
A child who fills the chart has practiced every row once, which is the blank chart’s job done by hand. A printed blank chart saves the ruler work.
How to use a blank multiplication chart
A filled chart is for finding and checking facts, and a blank chart is for practicing them, because filling it in is recall. Three ways to use one:
- A family at a time. Fill the rows and columns of the families learned so far, and leave the rest empty. The empty squares are what is left to learn.
- The mixed chart. The headers come in a shuffled order, so a child cannot count along a row and has to know each fact. Use it once a run of families is quick.
- The missing-number chart. A filled chart with about a third of the squares empty is a quick check of which facts are still slow.
Fill a blank chart for a few minutes, a few times a week, and only for the families being learned. The progressions say that practice which “focuses most heavily on understood but not yet fluent products” can speed learning (p. 27), and a whole chart every day spends most of its time on facts already known.
Time a fill-in only once it comes out right, and compare the time only with your child’s own last one.
Each blank and missing-number page has its answer key in the same PDF, so a child can mark their own. A chart filled from memory shows which facts are known and which are still counted: a picture of where practice should go, not a score.
Multiplication chart or flash cards?
A multiplication chart and flash cards do different jobs. The chart shows all the facts at once, their patterns, and which are known. Flash cards practice recalling one fact with no row to count along.
Use both, in that order: the chart while a family is new, flash cards once its facts can be worked out, and the chart again to check. The goal is the facts from memory by the end of third grade. The progressions describe the route as “becoming fluent for each number (e.g., the 2s, the 5s, etc.) and then extending the fluency to several, then all numbers mixed together” (p. 27), and the result as “the outcome of a carefully designed learning process that heavily involves the interplay of practice and reasoning”. The chart carries the reasoning and the patterns, and the cards carry the practice.
A fact comes off the chart once it comes without counting along the row.
Three common mistakes: starting on the 12 × 12 instead of the 10 × 10; a wall chart nobody looks at; and practicing the whole chart at once instead of one family.
Is it OK for my child to use a multiplication chart for homework?
Using a multiplication chart for homework is fine while a family of facts is new. A chart is a normal third-grade tool, and using it to find or check a fact is not cheating. It serves the goal quoted above: every fact from memory by the end of third grade.
The teacher’s rule comes first. Timed checks and some homework are meant to show what a child knows without the chart, so ask what a sheet is for.
Three signs a chart has become a crutch:
- Your child counts along a row for a fact practiced for weeks.
- Your child reaches for the chart for the 2s and the 10s.
- Homework is right with the chart and blank without it.
The fix is the next step, not taking the chart away. Move to the mixed blank chart, and put the chart away for the families that are known while keeping it for the facts still being learned.
Frequently asked questions
What is the best multiplication chart for kids?
A 10 × 10 chart with large numerals, a heavy header row and column, ruled lines that are easy to follow along a row, and the diagonal marked, so the mirror shows. Add a blank chart for your child to fill in, because filling it in is the practice. A 12 × 12 chart is the right one if your child's class uses it.
At what age should children start using a multiplication chart?
In third grade, at about 8 or 9, when children learn the multiplication facts and are expected to know them all from memory by the end of the year. A second grader can use the 2, 5, and 10 rows as a skip-counting strip. A younger child is better served by a hundreds chart.
Is a 12 × 12 chart better than a 10 × 10 for math learning?
Not for learning the facts the standards require. A 10 × 10 chart holds every product of two one-digit numbers, which is what the Common Core asks of third grade. Texas asks for facts up to 10 by 10. A 12 × 12 adds the 11s and 12s. Use it if your child's class does, and start on the 10 × 10 inside it.
Are printable multiplication charts as effective as flash cards for learning?
They do different jobs, so use both. A chart shows every fact at once, its patterns, and which facts are known, which suits a family of facts that is new. Flash cards practice recalling one fact with no row to count along, which suits facts a child can already work out. Go back to the chart to check.
When should children transition from using a multiplication chart to memorizing facts?
One family at a time, as soon as a fact comes without counting along the row. Start with the 2s, 5s, and 10s. Put the chart away for each family your child knows, and keep it for the facts that are left. By the 7s, only one new fact is left.
How often should kids fill in a blank multiplication chart?
A few minutes, a few times a week, and only for the families of facts being learned, not the whole chart every day. Practice spent on facts that are understood but not yet quick does the most good. Once the blank chart comes out right every time, switch to the copy with the headers mixed.
How is a multiplication chart different from a multiplication table?
It is not. A multiplication chart and a multiplication table are the same grid under two names. The numbers to multiply run across the top and down the side, and each product sits where a row and a column meet. A times table chart is a third name for it.
What does a multiplication chart 1-100 mean?
It means the 10 × 10 multiplication chart, with the numbers 1 to 10 across the top and down the side. Its products run from 1 × 1 = 1 to 10 × 10 = 100, which is where the name comes from. It holds every fact third grade asks children to know from memory.
Is a printed multiplication chart better than an app?
For learning the facts, a printed chart does things a screen cannot. A child can tick the facts they know, fill in a blank copy, check it against an answer key, and keep it on the desk during homework. A printed chart can also be folded, cut, or slipped into a plastic sleeve and used as a dry-erase chart.
Do the multiplication charts print in black and white?
Yes, by design. The families of facts are marked with bold lines and light hatching, and the diagonal with a heavy outline, never with color alone. Every chart prints clearly on any printer, even one low on ink. A child who wants color can color each row in as they learn it.
Related guides
Last updated